In [1]:
import numpy as np
import pandas as pd
In [2]:
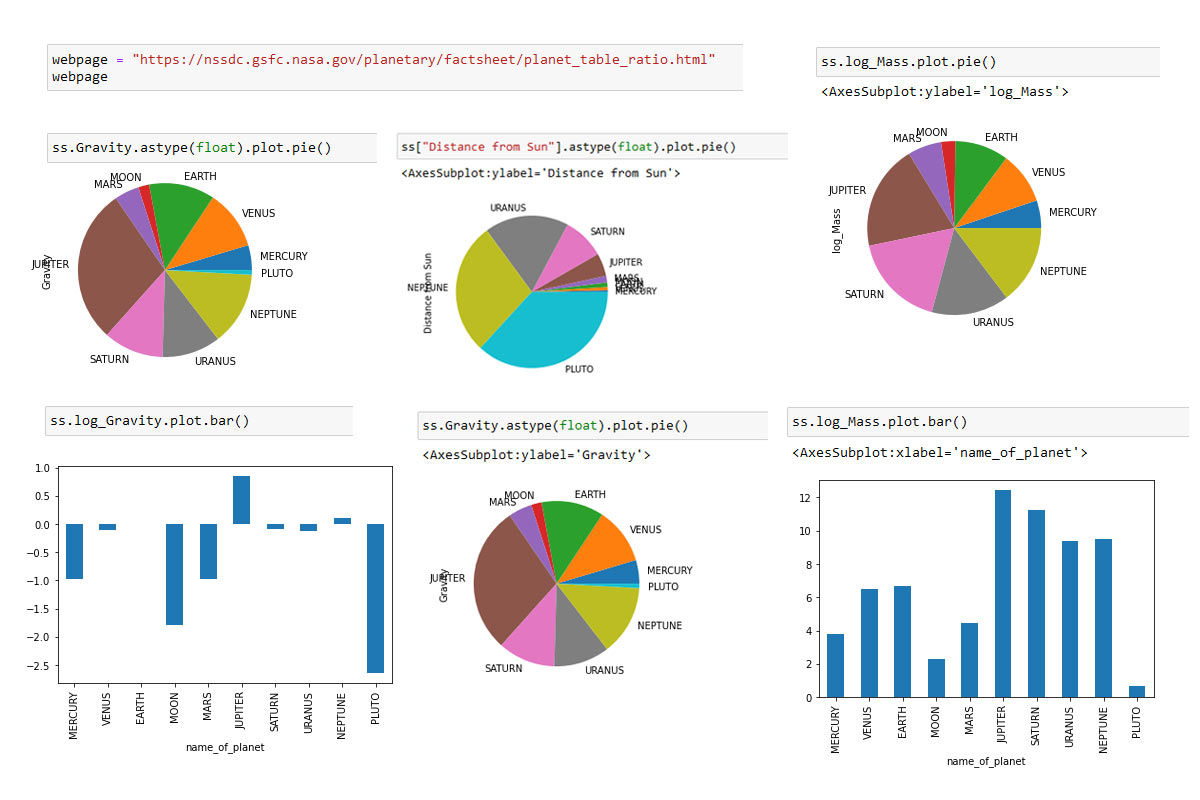
webpage = "https://nssdc.gsfc.nasa.gov/planetary/factsheet/planet_table_ratio.html"
webpage
Out[2]:
In [3]:
tables = pd.read_html(webpage, header = 0)
tables
Out[3]:
In [4]:
ss = tables[0]
ss
Out[4]:
In [5]:
ss.head()
Out[5]:
In [6]:
ss[0:5:2]
Out[6]:
In [7]:
ss[0:10:3]
Out[7]:
In [8]:
ss[10:19:3]
Out[8]:
In [9]:
ss[:]
Out[9]:
In [10]:
ss[-4:]
Out[10]:
In [11]:
ss[-10:]
Out[11]:
As you will see, it is a range of integers, from 0 to 19.
Please note that range(0, 19) starts with 0 and ends at 18. It does not include 19.
In [12]:
ss.index
Out[12]:
In [13]:
ss.columns
Out[13]:
In [14]:
ss.rename(columns =
          {'Unnamed: 0': 'properties'},
          inplace=True)
In [15]:
ss.columns
Out[15]:
In [16]:
ss = ss.set_index('properties')
ss
Out[16]:
In [17]:
ss.index
Out[17]:
In [18]:
ss.columns
Out[18]:
In [19]:
ss.T
Out[19]:
In [20]:
ss
Out[20]:
In [21]:
ss = ss.T
ss
Out[21]:
In [22]:
ss.index.names = ['name_of_planet']
ss
Out[22]:
In [23]:
ss.dtypes
Out[23]:
In [24]:
ss.Gravity.astype(float)
Out[24]:
See the mass of Jupiter, it is huge.
In [25]:
ss.Gravity.astype(float).plot()
Out[25]:

We can see that Jupiter has almost three times the mass of all other planets put together.
In [26]:
ss.Gravity.astype(float).plot.pie()
Out[26]:

In [27]:
ss.Gravity.astype(float).plot.bar()
Out[27]:

In [28]:
ss['log_Gravity'] = np.log(ss.Gravity.astype(float))
In [29]:
ss.columns
Out[29]:
In [30]:
ss[['Gravity', 'log_Gravity']]
Out[30]:
As the above data is comparison with the Earth, its value is 0. Smaller than the Earth are negative and others positive.
In [31]:
ss.log_Gravity.plot.bar()
Out[31]:

In [32]:
ss['log_Mass'] = np.log(ss.Mass.astype(float) / float(ss.Mass['PLUTO']))
In [33]:
ss[['Mass', 'log_Mass']]
Out[33]:
Now all values are positive as they are larger than Pluto
In [34]:
ss.log_Mass.plot.bar()
Out[34]:

In [35]:
ss.log_Mass.plot.pie()
Out[35]:

In [36]:
ss['log_Mass'] = np.log(ss.Mass.astype(float) / float(ss.Mass['PLUTO'])* 2 )
In [37]:
ss['log_Mass']
Out[37]:
In [38]:
ss.log_Mass.plot.bar()
Out[38]:

In [39]:
ss.log_Mass.plot.pie()
Out[39]:

In [40]:
ss["Distance from Sun"]
Out[40]:
We convert first to str, then replace *
In [41]:
ss["Distance from Sun"] = ss["Distance from Sun"].str.replace('\*', '')
In [42]:
ss["Distance from Sun"]
Out[42]:
In [43]:
ss["Distance from Sun"].astype(float).plot.pie()
Out[43]:

In 'Surface Pressure', we have some 'Unknown*' values. We will remove them to plot charts.
Let us first create a separate series of Surface Pressure only so that we don't change our original data.
In [44]:
ss_sp = ss["Surface Pressure"]
ss_sp
Out[44]:
In [45]:
ss_sp = ss_sp[~ss_sp.str.contains("Unknown")]
All records with 'Unknown' are removed.
In [46]:
ss_sp
Out[46]:
In [47]:
ss_sp.astype(float).plot.bar()
Out[47]:

In [48]:
ss_sp.astype(float).plot.pie()
Out[48]:
